Skip to content
QX - 15 Case of Study

Calculate Inverter Performance for a Portfolio of 60 Assets to Prioritise maintenance

Maintenance Management
Performance Analysis
Operator Control

This case study presents the successful implementation of an innovative solution to calculate and report on a daily basis for asset managers a list of inverters and their modules, along with their daily yield (Performance Ratio) for the current month across a portfolio of 60 PV plants. The solution not only ranks the inverters from lowest to highest yield, but also produces a heat map highlighting those inverters whose yield is below the asset average. In addition, the solution calculates disconnection time, providing a complete picture of the performance and operational efficiency of solar power generation.

CONTEXT

The client, a leading renewable energy player (Independent Power Producer or IPP), managed a large portfolio of 60 PV plants in various geographical locations. Optimising inverter performance and identifying problem areas were essential for maximising the solar power generation's efficiency and profitability.

CHALLENGES

The client faced the following challenges:

  • Detailed Visualisation: The lack of a tool providing a detailed visualisation of inverter and module performance made it hard to identify problems early on.
  • Complete Comparison: Manually comparing inverter and module performance was time consuming, with limited analysis potential for a portfolio of this size.
  • Identifying Problems: Lack of a visual representation of underperforming inverters made it difficult to quickly detect problem areas.

SOLUTION

Quintas Analytics designed and implemented a complete solution to address the above challenges:

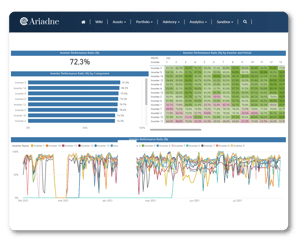
  • Centralised Monitoring Platform: A platform was developed that collected and processed daily data on asset irradiation and inverter and module production.
  • Performance Ratio Calculation:  An algorithm was implemented to calculate the daily Performance Ratio (PR) for each inverter and module, based on production and solar irradiation data.
  • Heat Map: The solution automatically sorted inverters from lowest to highest performing, and produced a heat map highlighting inverters that underperformed compared to the average output.
  • Disconnection Time Calculation: A module was developed that calculated the total disconnection time of the inverters throughout the month.
  • Automatic Notifications: The solution sent daily notifications to asset managers, providing a list of inverters, along with their PR, heat map and disconnection time.
QX 15 Case of use - Report

RESULTS AND BENEFITS

The implementation of the solution had a significant impact on portfolio performance management and operational efficiency:

1. Unified Visualization: The platform provided a detailed and accessible visualization of inverter and module performance for the entire portfolio.
2. Rigorous Analysis: The ordering and heat mapping allowed for a deeper and faster analysis of asset performance by the management team.
3. Problem Detection: The heat map facilitated quick visual identification of underperforming inverters.
4. Performance Optimisation: Early identification of problem areas led to an improvement in the overall performance of the portfolio.
5. Operational Efficiency: Automation of the entire process spared the management team the tasks of manually downloading data, integration and analysis, freeing up time for faster management and operational decision making.

CONCLUSIONS

The solution implemented for inverter performance monitoring with heat map and off-time calculation in a portfolio of 60 PV plants was very successful regarding the optimisation and efficiency of solar power generation. The advanced monitoring platform, intuitive visualisation and daily notifications provided essential tools for effective and cost-efficient management, freeing the management team from manual tasks of downloading and processing data from SCADA and streamlining operational decision making. This solution sets a valuable example for the management of similar projects in the solar PV field.

WANT TO TAKE A CLOSER LOOK?

Download your copy of this Case of Use now and discover the key to Automation and Business Intelligence for Renewable Energy management. Uncover new possibilities for efficiency and growth!