Calculate the Impact of Spanish Network Managers' Instructions to Assess their Effect on Projects
Network Management
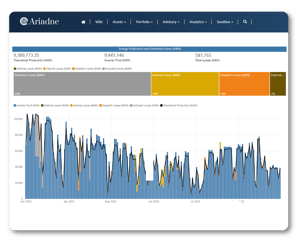
Loss Estimates
Capacity Limitation
SOLUTION
Quintas Analytics developed and deployed a comprehensive automated solution to address the challenges mentioned above:
- Automatic Data Collection: A system was designed to automatically collect power limitations, solar irradiation data, market and contract prices.
- Automatic Loss Calculation: The solution calculates hourly production and revenue losses based on collected data and defined parameters.
- Daily Notification and Updates: The management team receive a daily report detailing losses and revenue variances, allowing for more effective communication with the network operator and the updating of financial models.